How to Read Supply & Demand Zones Like a Floor Trader: CK's Clean Charting Method for Passing Your Prop Firm Evaluation
Most traders do not fail a prop firm evaluation because they cannot find a trade. They fail because they take too many trades, trade through market noise, or risk too much on setups that were never high quality to begin with.
CK’s clean charting method solves the first problem: clarity.
Instead of covering your TradingView screen with indicators, trendlines, and conflicting signals, we focus on three things:
- The macro and micro trend
- High-quality supply and demand zones
- Defined risk before the order is placed
This approach is designed to help traders pursue prop firm capital with discipline: not gamble their personal savings. In some promotional periods, traders may be able to begin an evaluation for as little as $20 instead of risking $2,500 or more of their own money. However, the evaluation fee is not your total risk. You still need a strategy, emotional control, and a complete understanding of the firm’s current rules.
At CK Trading Institute, we teach traders how to leverage structured analysis, live education, and AI-powered tools such as the Automated Trade Assistant (ATA) to pursue mastery one clean setup at a time.
“Passed the 50k eval in 9 days. Only risked $20 of my own money. This is a game changer.” : Sarah L., CK community member
“I used to blow accounts every week, but the drawdown management tool in the algorithm literally saved me.” : Marcus T., CK community member
WHAT SUPPLY AND DEMAND ZONES REALLY MEAN
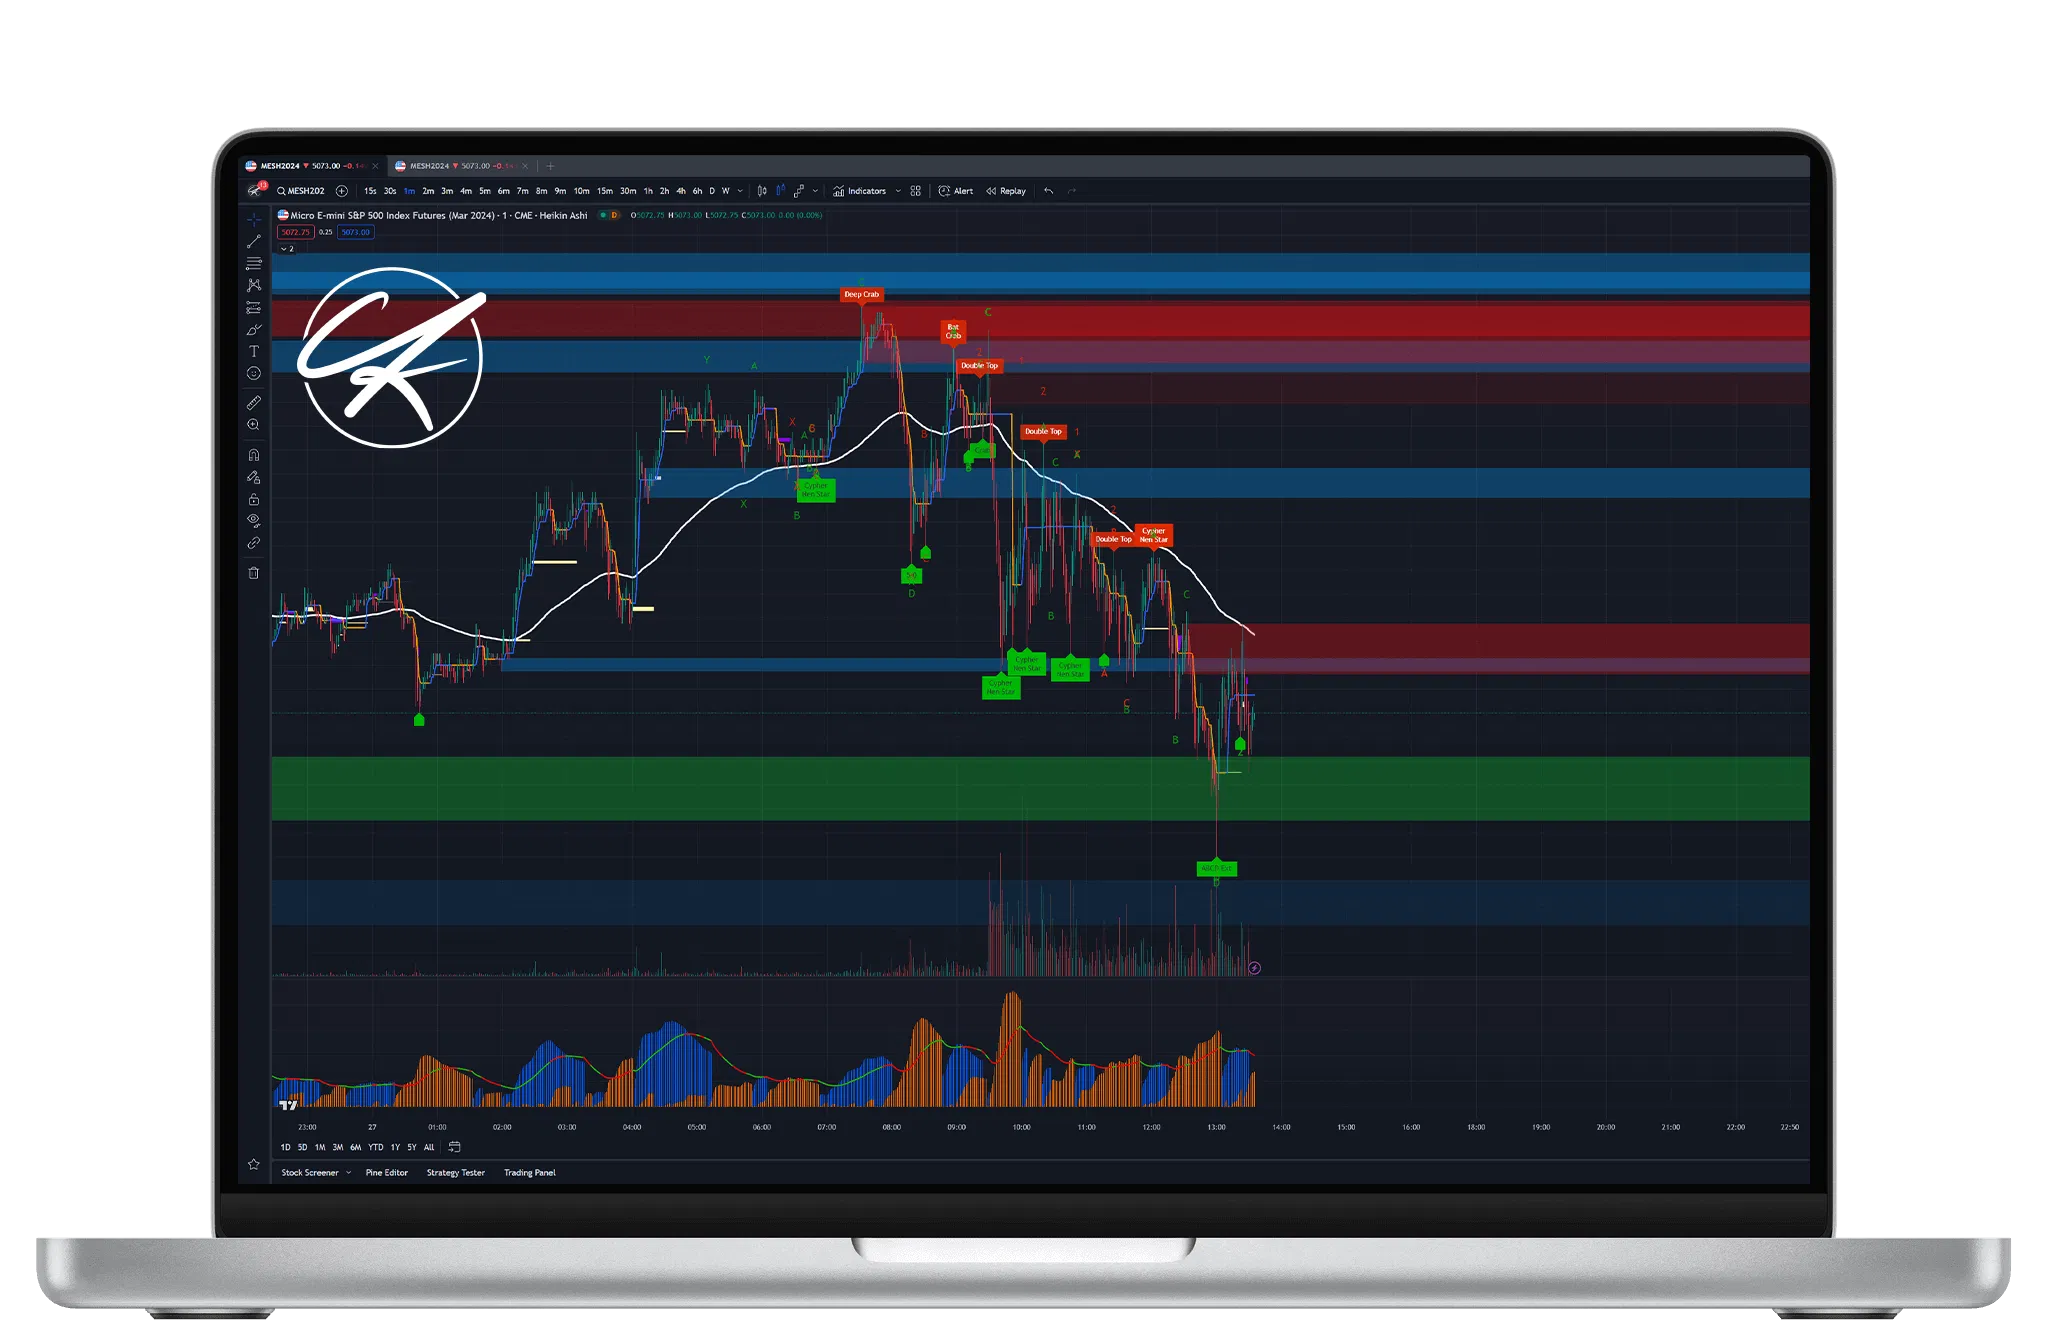
A demand zone is an area where aggressive buying previously entered the market. Price moved away from that area with enough strength to break a prior swing high or change the short-term structure.
A supply zone is the opposite. It is an area where aggressive selling entered the market, pushing price lower and breaking a prior swing low.
Think of these zones as locations where the market previously showed clear imbalance between buyers and sellers.
The key is not simply finding a green or red rectangle. A valid zone should explain a significant move.
- Demand is generally found below current price.
- Supply is generally found above current price.
- The strongest zones usually form after a brief consolidation.
- The move away should be fast and decisive.
- The move should break meaningful market structure.
- The first retest is often more valuable than repeated retests.
The objective is to stop trading in the middle of nowhere. We want to wait for price to return to an area where the market has already demonstrated its intent.

CK’S CLEAN CHARTING METHOD: FIVE STEPS
1. START WITH THE MACRO TREND
Before searching for an entry, zoom out.
Use a higher timeframe: such as the 1-hour or 4-hour chart: to determine whether the market is broadly trending higher, trending lower, or moving sideways. Then use an intraday timeframe, such as the 5-minute or 15-minute chart, to refine the setup.
When the macro trend is bullish, we prioritize demand zones and long opportunities. When the macro trend is bearish, we prioritize supply zones and short opportunities.
This does not mean countertrend trades are impossible. It means they require stronger proof and should generally be approached with less risk.
A common evaluation mistake is buying every small demand zone during a major downtrend or shorting every supply zone during a major rally. Clean charting begins with context. Establish the dominant direction before you focus on execution.
Action: Mark the higher-timeframe trend before the market opens. Do not allow a one-minute candle to determine your entire trading bias.
2. FIND THE BASE THAT CAUSED THE IMPULSE
Look left on the chart for a powerful move.
For a demand zone, identify the last bearish candle or small group of candles before price rallied aggressively. For a supply zone, identify the last bullish candle or small group of candles before price sold off sharply.
That small consolidation is the base.
A clean base usually has:
- Tight candles
- Limited overlap
- A short period of sideways movement
- A strong, impulsive departure
- A clear break of structure
Avoid zones created by slow, overlapping price action. If price drifted away without conviction, the zone may not represent meaningful order flow.
Draw the demand zone from the lower extreme of the base to the upper edge of the consolidation. For supply, draw from the upper extreme down to the lower edge of the base. Extend the rectangle to the right so you can monitor the retest.
Action: Keep only zones that caused a meaningful structural move. Delete zones that merely produced a minor bounce.
3. REQUIRE A BREAK OF STRUCTURE
A zone is stronger when it produces a measurable change in market structure.
For demand, price should close above a previous swing high. For supply, price should close below a previous swing low.
This filter removes a large amount of chart clutter. Without a structural break, you may simply be marking random pauses in price.
You can also look for additional confirmation:
- A liquidity sweep below a prior low before a demand move
- A liquidity sweep above a prior high before a supply move
- A visible imbalance or fair value gap
- Large momentum candles leaving the base
- Alignment with a higher-timeframe zone
These features do not guarantee a winning trade. They improve the quality of the decision-making process by requiring evidence that buyers or sellers actually took control.
Action: Do not label a zone “high probability” until price proves that it displaced the opposing side.
4. WAIT FOR THE FIRST CLEAN RETEST
The first return to a fresh zone is often the most important test.
When price revisits demand, buyers may defend the area again. When price revisits supply, sellers may defend it again. Each subsequent test can consume resting orders and weaken the zone.
You have two primary entry styles:
Limit entry: Place an order near the edge of the zone before price arrives. This offers a better price but provides less confirmation.
Confirmation entry: Wait for a rejection wick, engulfing candle, or lower-timeframe structure shift inside the zone. This may produce a later entry, but it can reduce the chance of entering during a failed reaction.
For prop firm evaluations, confirmation entries are often easier for newer traders to execute because they force patience. The trade does not begin simply because price touched a rectangle. Price must show that the zone is working.
Action: Choose one entry model and apply it consistently. Do not switch between limit and confirmation entries based on fear or excitement.
5. DEFINE THE TRADE BEFORE YOU ENTER
Your stop-loss belongs beyond the zone: not at an arbitrary distance that makes the position look more comfortable.
For a long trade, the stop generally belongs below demand. For a short trade, it generally belongs above supply. The exact distance must account for volatility, the instrument, and the size of the zone.
Your target should be logical. The next opposing zone, recent swing high, or recent swing low can provide a reasonable objective.
Before entering, calculate:
- Entry price
- Stop-loss price
- Dollar risk
- Number of contracts
- Profit target
- Maximum daily loss
- What would invalidate the setup
If you cannot define these items, you do not have a complete trade plan.
HOW TO APPLY SUPPLY AND DEMAND TO A PROP FIRM EVALUATION
Passing an evaluation is not about making the largest possible profit in the shortest period. It is about reaching the target while protecting the account from drawdown violations.
Rules vary by firm, account type, and program. Always review the current Apex Trader Funding rules before trading. Pay particular attention to trailing drawdown, contract limits, permitted products, trading hours, consistency requirements, and payout conditions.
CK’s evaluation framework is straightforward:
- Trade the smallest practical position size.
- Consider micro contracts such as MES or MNQ while building consistency.
- Risk a small, predetermined amount per trade.
- Limit yourself to one to three high-quality setups per day.
- Stop trading after reaching your personal daily loss limit.
- Never widen a stop to avoid accepting a loss.
- Do not add to a losing position.
- Take reasonable profits rather than waiting for a home run.
- Journal every trade and identify whether you followed the plan.
A trailing drawdown makes unrealized profit especially important. If a trade moves significantly in your favor and then reverses sharply, the account’s threshold may have moved higher while your realized profit remains small. Consider taking partial profits or protecting a portion of the trade once the setup reaches a meaningful multiple of your initial risk.
The goal is to build a cushion: not to repeatedly approach the danger line.
WHERE ATA FITS INTO THE PROCESS
The Automated Trade Assistant (ATA) is a TradingView-based algorithmic tool designed to help traders analyze market conditions with greater structure and efficiency.
ATA can assist with:
- Highlighting potential supply and demand areas
- Identifying momentum shifts
- Organizing entry and exit information
- Filtering some low-quality or conflicting conditions
- Supporting stop-loss and risk-planning decisions
ATA is not a substitute for judgment, and no algorithm can eliminate market risk. Use it as a decision-support tool: not as an excuse to abandon your trading plan.
The cleanest process is:
- Identify the higher-timeframe bias.
- Mark the strongest zones manually or with ATA support.
- Wait for price to approach the zone.
- Review momentum and structure.
- Execute only if the complete plan is valid.
- Manage the position according to predefined risk.
Learn more about improving your TradingView process in CK’s guide to TradingView indicator tips.

THE DAILY FLOOR-TRADER ROUTINE
Before the session:
- Review the higher-timeframe trend.
- Mark major supply and demand zones.
- Identify the nearest opposing zone.
- Check scheduled economic news.
- Choose your maximum daily risk.
- Decide which instruments you will trade.
During the session:
- Wait for price to reach your area.
- Avoid chasing candles away from the zone.
- Confirm the structure before entering.
- Record your entry, stop, target, and reasoning.
- Stop when your daily rules say to stop.
After the session:
- Save a chart screenshot.
- Grade the quality of the zone.
- Record whether you followed your rules.
- Note emotional decisions.
- Identify one improvement for the next session.
This routine removes noise and turns trading into a repeatable operating process.
READY TO LEVERAGE APEX TRADER FUNDING?
You do not need thousands of dollars in personal capital to begin learning how to trade with structure. Depending on current promotions, an evaluation may be available for as little as $20, while successful traders may pursue access to significantly larger buying power.
That opportunity comes with responsibility. Treat the evaluation as a professional risk-management test. Use CK’s clean charting method, focus on high-quality supply and demand zones, and maximize consistency before increasing size.
GET UP TO 90% OFF APEX TRADER FUNDING
Use affiliate code: KZRKEGJN
Start your evaluation through the direct link below:
CLAIM YOUR APEX TRADER FUNDING DISCOUNT NOW
Review all current rules, fees, risks, and eligibility requirements before purchasing. Results are not guaranteed, and trading involves substantial risk.
YOUR NEXT STEP
Start with one market, one session, and one clean setup model.
Mark your zones. Wait for structure. Define your risk. Execute without chasing. Then review your performance honestly.
For a deeper foundation, read CK’s five-step guide to passing a prop firm evaluation and explore the ultimate futures trading guide.
Financial freedom is not built from random trades. It is built through preparation, discipline, community, and mastery. Clean the chart. Protect the account. Seize the next qualified opportunity.